
Still Think People Counting Is Just About Counting Heads? See the Data Value Behind Shopee's Pickup Store Expansion!

While convenience stores already blanket the streets, Shopee's pickup stores are quietly catching up, becoming Taiwan's third-largest pickup channel with a more automated, convenient delivery model.
This success didn't happen overnight. It is the result of long-term data analysis that reshaped logistics, store layout, and consumer behavior planning.
What Shopee's Pickup Store Expansion Reveals About Data-Driven Transformation in Physical Retail
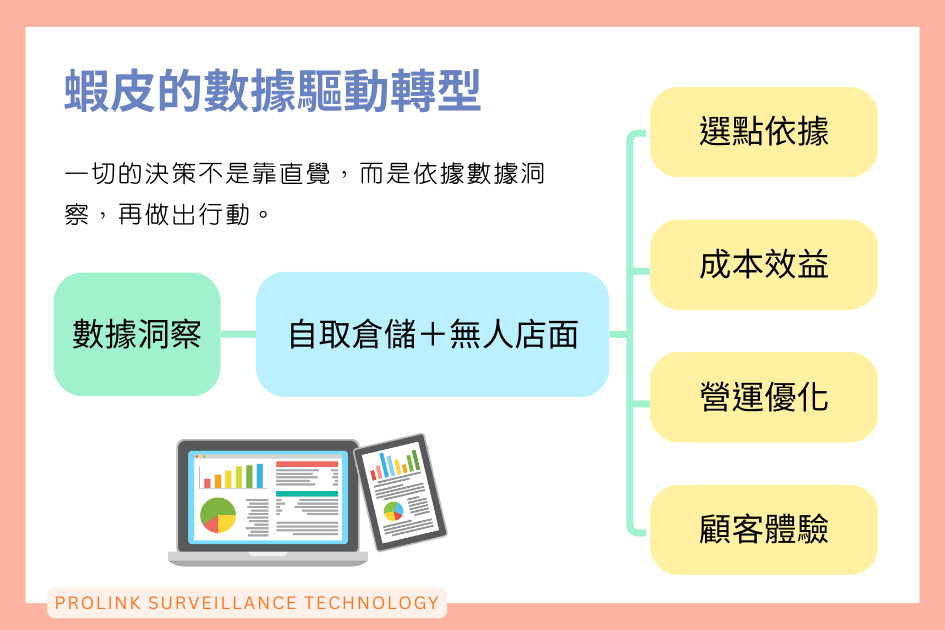
They replaced traditional staffing with a "self-pickup warehouse plus unmanned storefront" model, and redirected resources toward efficient store expansion and prime location placement.
More importantly, their decisions are not based on intuition:
- Site Selection Criteria: Based on data such as population density, customer behavior, and consumer hotspots, they precisely select locations best positioned to serve high-demand customer segments.
- Cost Efficiency: Since roughly 70% of orders use store-to-store pickup, Shopee has built out its own pickup network and used data to optimize logistics and warehousing, saving an estimated NT$6 billion in logistics costs annually.
- Operational Optimization: Accurately forecasting order volume to optimize logistics and warehousing capacity, significantly improving fulfillment and delivery efficiency.
- Customer Experience: Integrating online orders with offline pickup to deliver a more convenient OMO experience, effectively boosting customer loyalty
A Historical Warning: Why Did Traditional Retail Lose Out to E-Commerce?
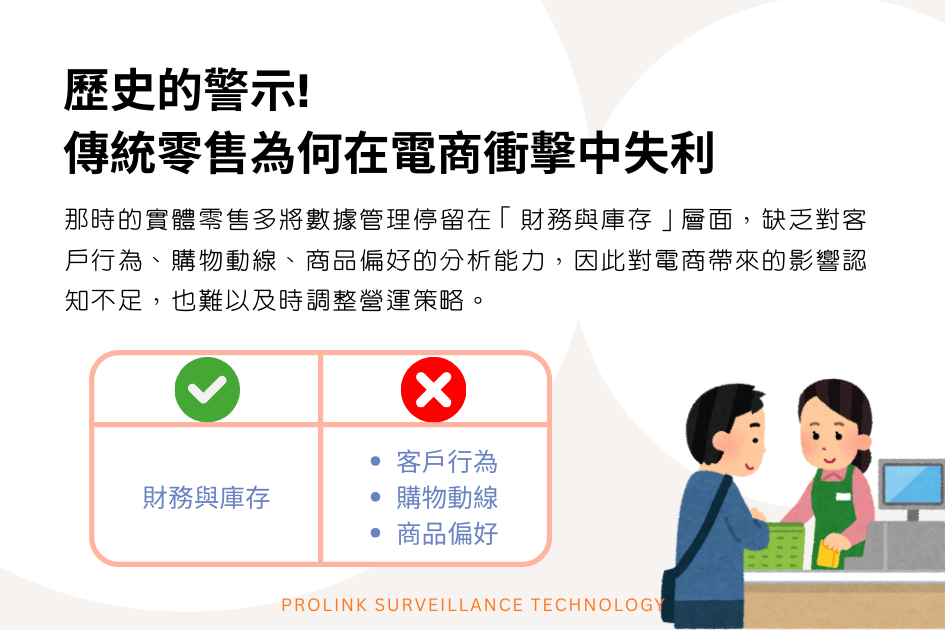
From the mid-2000s to the early 2010s, online shopping rapidly took off, bringing advantages like price transparency, easy platform comparison, fast delivery, and convenient convenience-store pickup, dealing an unprecedented blow to brick-and-mortar stores.
At the time, physical retailers largely kept their data management confined to finance and inventory, lacking the ability to analyze customer behavior, shopping paths, or product preferences. As a result, they underestimated the impact of e-commerce and struggled to adjust their strategies in time.
Why Did E-Commerce Win Back Then? Because It Had "Every Kind of Data"
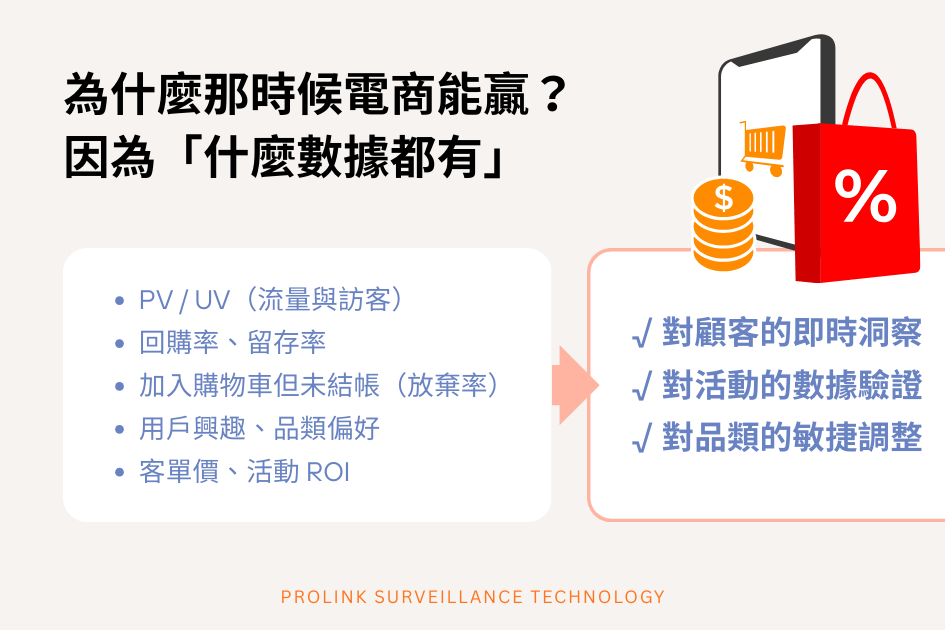
E-commerce platforms are inherently built with complete data tracking capabilities, including:
- PV / UV (traffic and visitors)
- Repeat purchase rate and retention rate
- Items added to cart but not checked out (abandonment rate)
- User interests and category preferences
- Average order value and campaign ROI
This allowed e-commerce to accomplish three things:
- Real-time insight into customers (knowing who visited, what they viewed, what they liked)
- Data-driven validation of campaigns (whether a promotion worked, which categories drove sales)
- Agile category adjustments (real-time restocking, listing/delisting, display changes)
As Online Ad Costs Rise, Brands Return to Offline, Making OMO a Key Strategy

As CPC and CPM for Google and Facebook ads climb year after year, customer acquisition costs on e-commerce platforms keep rising. Brands have therefore re-examined the value of offline channels, and as data technology has matured, more brands are bringing "online data thinking" back to physical retail:
- Using "people counting" to quantify in-store foot traffic
- Using "path and heat map analysis" to understand how customers browse the store
- Using "conversion rate and repeat-purchase metrics" to boost in-store sales efficiency
As a result, many brands are returning to physical retail, opening pop-up stores, counters, or flagship stores to engage consumers directly and build brand trust.
At the same time, OMO (Online-Merge-Offline) integrates online and offline channels, unifying data and revenue across both:
- Zara: Online app plus in-store pickup
- Uniqlo: Order online, pick up in-store
- SHEIN: Online hit products plus pop-up stores to drive traffic
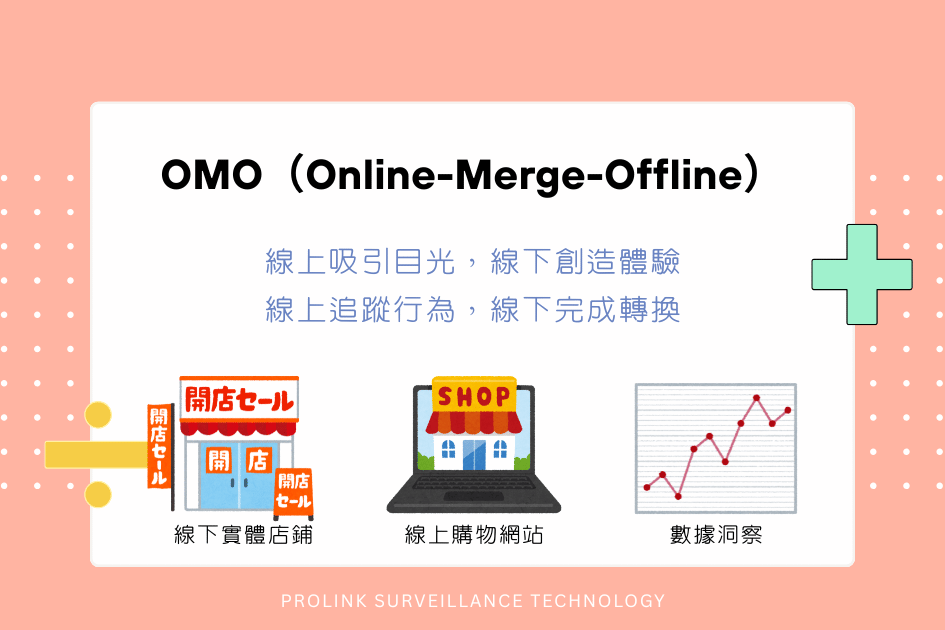
The essence of OMO is:
Attract attention online, create experiences offline; track behavior online, complete conversion offline
People Counting Is No Longer Just About Counting Heads
In the past, many retailers used people counting simply to record daily store visits, paired with basic conversion rate analysis.
But the value of foot traffic data goes far beyond that. It can actually reflect changes driven by the external environment, and can even help stores uncover opportunities they would otherwise never notice.
For example:
Scenario 1: A Light Meal Café x External Event (Fitness Crowd)
After a nearby gym launched a new class, foot traffic at a light meal café increased between 7 and 9 PM 25%。
Decision and Insight:
The store determined this traffic was a natural spillover from post-workout customers, unrelated to its own promotions.
Result:
The store introduced a "post-workout protein box" during that time slot and shortened meal prep time.
After launch, evening takeout orders increased, and overall revenue grew as well.
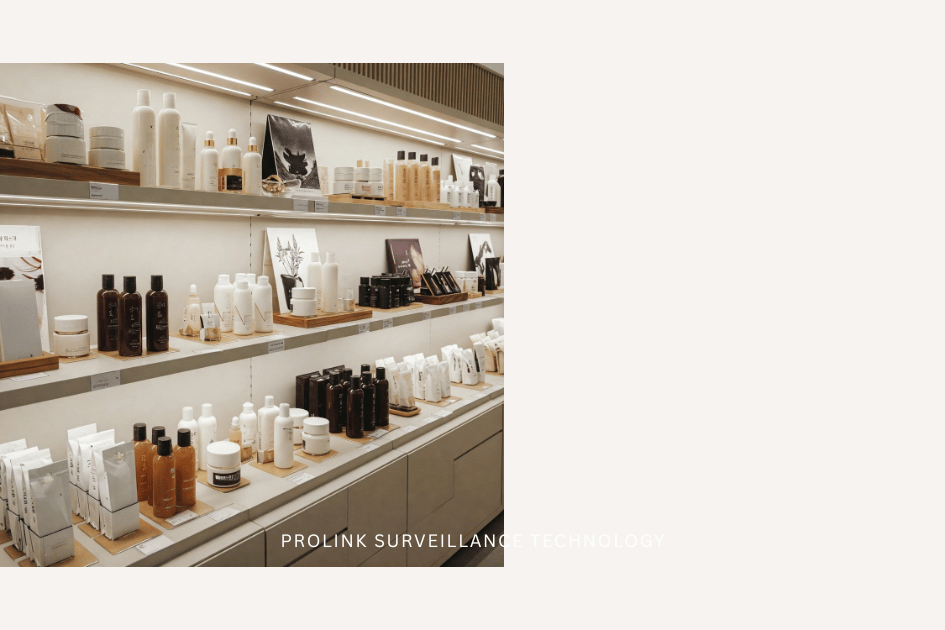
Scenario 2: A Beauty Brand x OMO Traffic Driving (Gift Redemption)
A beauty brand ran an Instagram ad encouraging followers to "visit a store for a free skin test," aiming to drive online traffic to its physical counters.
Observed Data:
- During the campaign, foot traffic increased compared to the previous week by 28%。
- but the conversion rate after the skin test actually dropped by 10%。
Strategy Adjustment:
The data showed the ad successfully drove people into the store, but most were only there to "get the experience and claim a gift," not genuinely interested in buying skincare products.
The brand then revised its messaging to: "Complete a skin test and try the new serum to receive a sample set," aiming to attract the right audience.
Result:
In the next campaign, foot traffic increased by only 15%, but the conversion rate rebounded by 7%,
and the counter's serum sales that month rose by 20%
People Counting Paired with These Features Makes the Data More Complete!
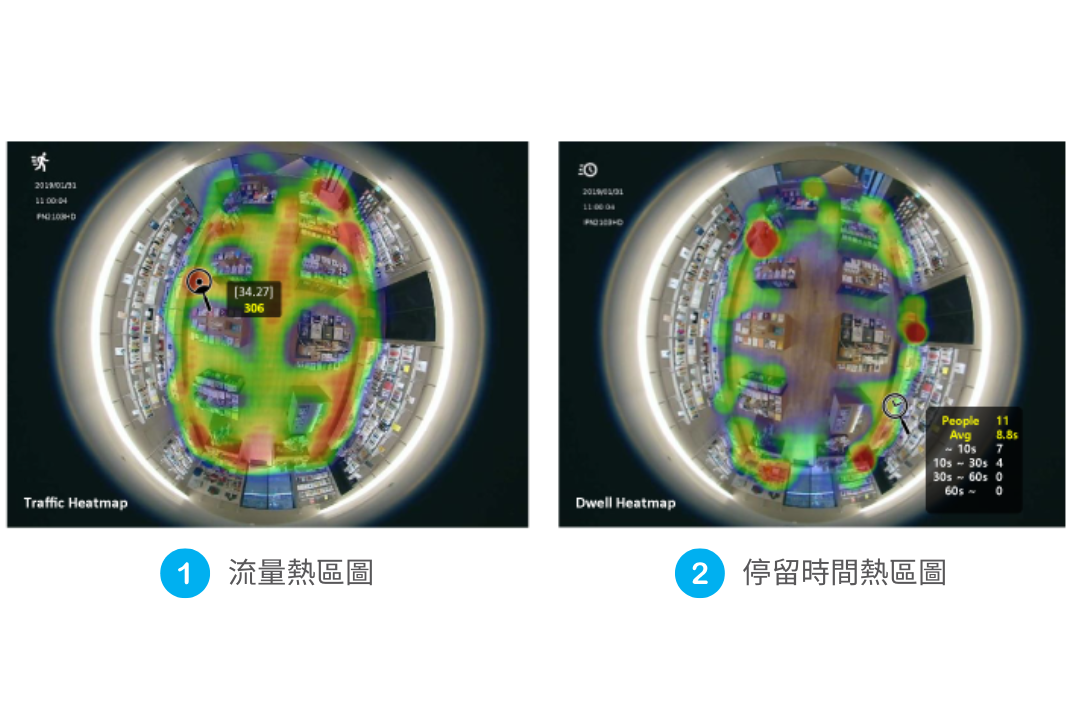
Heat Map Analysis
Visualize which areas customers linger in longest and where crowds gather most.
- Adjust product placement: for example, if a discount zone sees 30-minute dwell times while a new arrivals area only sees 5 minutes, move the new arrivals closer to the entrance or main path.
- Check visual merchandising (VM) effectiveness: are promotional displays or sampling stations actually drawing people in? Low foot traffic in a display area signals it needs adjustment.
- Improve in-store flow: identify congestion-prone spots, such as in front of checkout counters or narrow aisles, and adjust the layout or add staff accordingly
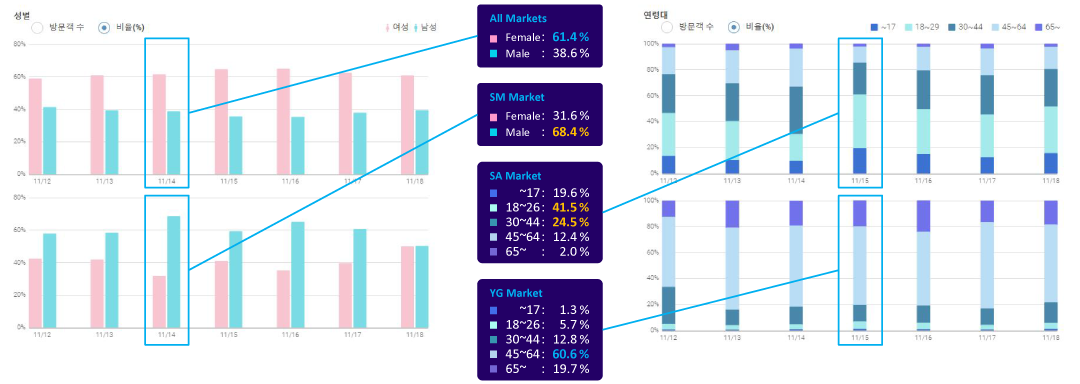
Gender and Age Statistics
Use AI video analytics to understand the gender and approximate age group of visiting customers.
- Validate the target audience: do actual visitors match the brand's intended target demographic.
- Optimize product mix: if young women make up a high proportion of visitors, increase inventory of related fashion items or accessories.
- Precision marketing: display or play the most relevant promotional content during time slots when a particular demographic is most present.
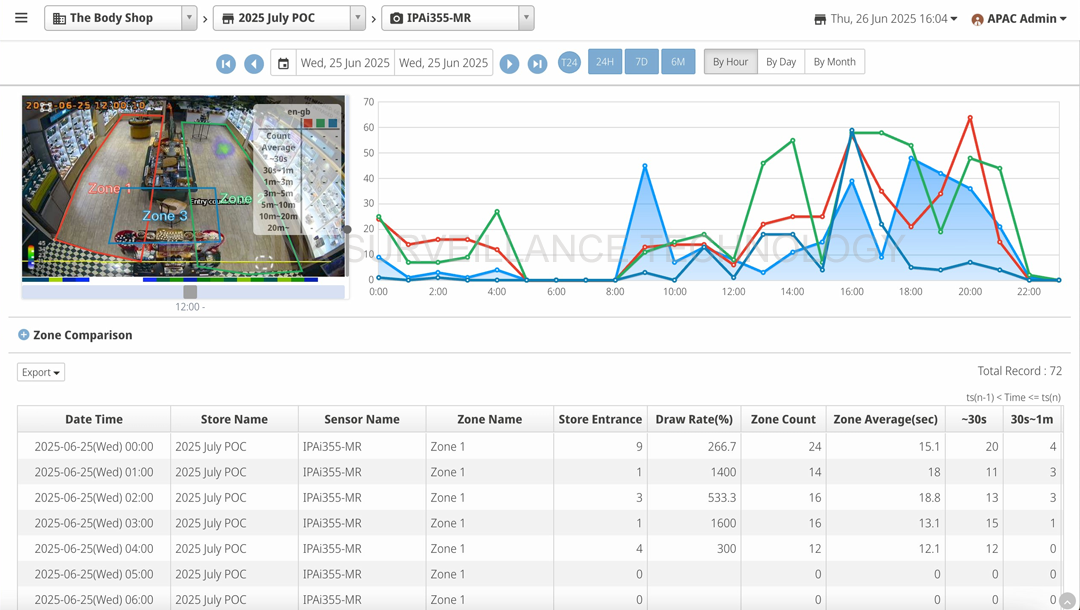
Zone Conversion Rate Analysis
Borrowing the e-commerce concept of "conversion rate," compare foot traffic in each zone against the actual purchases of products in that zone.
- Identify sales bottlenecks: distinguish between high-traffic, low-conversion zones and low-traffic, high-conversion zones. High traffic with poor conversion suggests interest exists, but pricing, labeling, or service may need adjustment.
- Evaluate zone performance: use objective data to assess the performance of each counter or zone, rather than relying on sales figures alone.
- Optimize pricing and promotions: if a product in a certain zone is viewed often but rarely purchased, consider a price cut, clearer labeling, or a paired promotion.
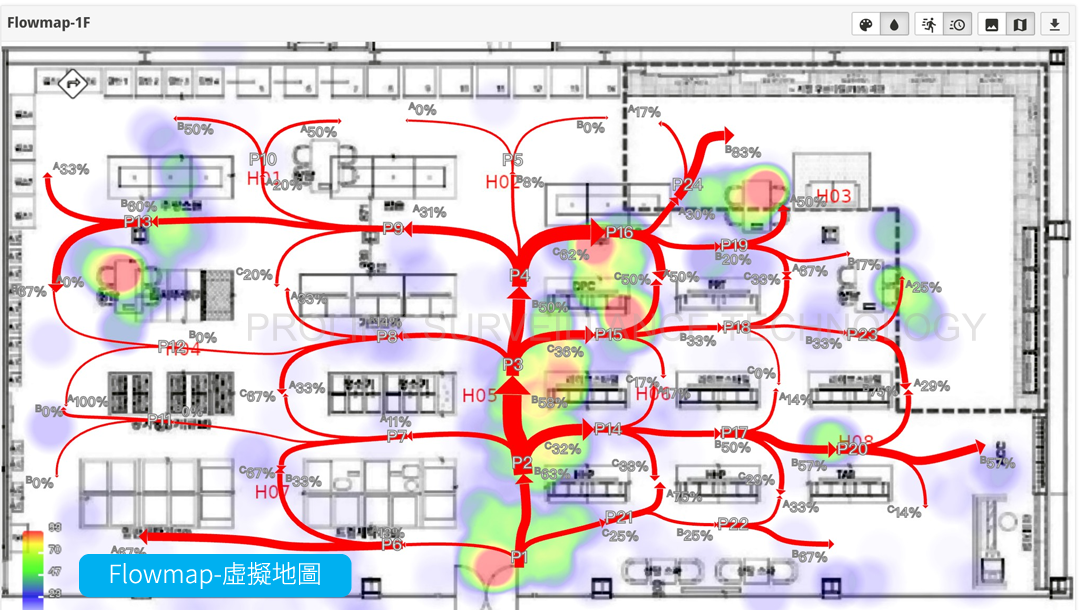
Path Analysis
Track customers' walking routes and movement sequence after entering the store to identify the most overlooked blind spots and the most popular paths.
- Design a smoother shopping path: guide customers naturally past all key promotional points, for example by placing traffic-driving products further inside so customers pass through more product zones.
- Adjust service point locations: fitting rooms, sampling areas, and customer service counters should sit along a smooth path, reducing detours or difficulty finding them.
- Improve aisle width: identify spots where customers frequently turn back or stop suddenly, which usually indicates an aisle is too narrow or obstructed and needs adjustment.
The Value of Data Lies in Continuous Tracking and Evolution
Data doesn't show results after just one day or one week.
Many stores conclude that "foot traffic data isn't useful" simply because they only collect it without analyzing it.
The real value emerges from changes observed over the long term.
Only continuous tracking reveals a brand's own rhythm and growth trajectory.
Once enough data has accumulated, it can be handed to a BI Consultantfor further support in:
Identifying trends, uncovering hidden issues, and proposing actionable decisions.
The true value of data has never been in a single count, but in what the long-term accumulation drives: the evolution of a business model and the optimization of resource allocation. Shopee's pickup store expansion is the clearest, most accessible example of this.